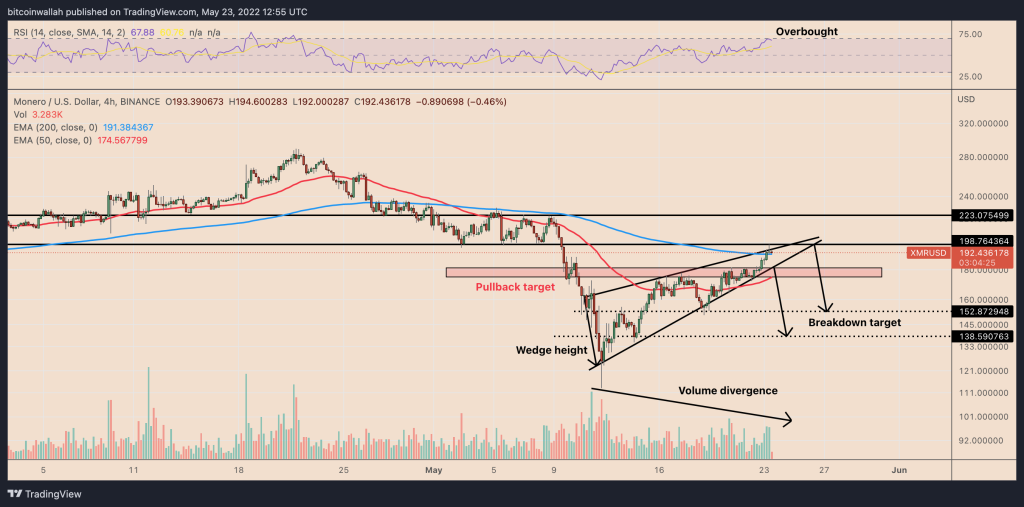
Monero (XMR) price may witness a sharp pullback by June because its 75% rally in the last two weeks has left the gauge almost “overbought.”
Monero price RSI meets rising wedge
Downside risks have been mounting due to XMR’s relative strength index (RSI), which almost hit 70 this May 23, indicating that the market is considered overvalued. An oversold RSI could amount to a bout of declining moves, as a rule of technical analysis.
Additionally, Monero is also painting a bearish reversal pattern, dubbed the rising wedge. Rising wedges form when the price moves inside a range defined by two ascending, converging trendlines.
As they do, the volumes typically decline, underscoring a lack of conviction among traders about the upside price move.
Rising wedges typically resolve after the price breaks below their lower trendline, followed by an extended move downside to the level that traders locate after adding the maximum wedge’s height to the breakdown point.

As a result of this technical rule, XMR risks falling toward $138.50 by June—down nearly 30% from May 23’s price—if the breakdown point comes to be around $180. A breakdown move that appears near the apex point around $200 would shift the wedge’s downside target to nearly $150.
A slightly bullish XMR setup
Concurrent with the rising wedge, XMR has also been forming an ascending channel pattern, confirmed by at least two reactive highs and lows across the past two weeks, as shown below.

XMR now trades in the middle of its ascending channel range, eyeing a close above $200, a historically significant support level, albeit acting as resistance. Meanwhile, the token holds its 200-4H exponential moving average (200-4H EMA; the blue wave) near $191 as its interim support.
Related: Indie Russian news firm raises $250K in crypto after sanctions cripple finances
If the price breaks above $200, it would invalidate the bearish reversal setup posed by the falling wedge pattern discussed above. XMR’s decisive jump would shift its interim upside target near $220, up about 15% from May 23’s price.
Conversely, failing to close above $200 would increase XMR’s risks of declining toward the $180–$175 range, marked as the “pullback target” in the chart above. The area coincides with the ascending channel’s lower trendline.
The views and opinions expressed here are solely those of the author and do not necessarily reflect the views of Cointelegraph.com. Every investment and trading move involves risk, you should conduct your own research when making a decision.


