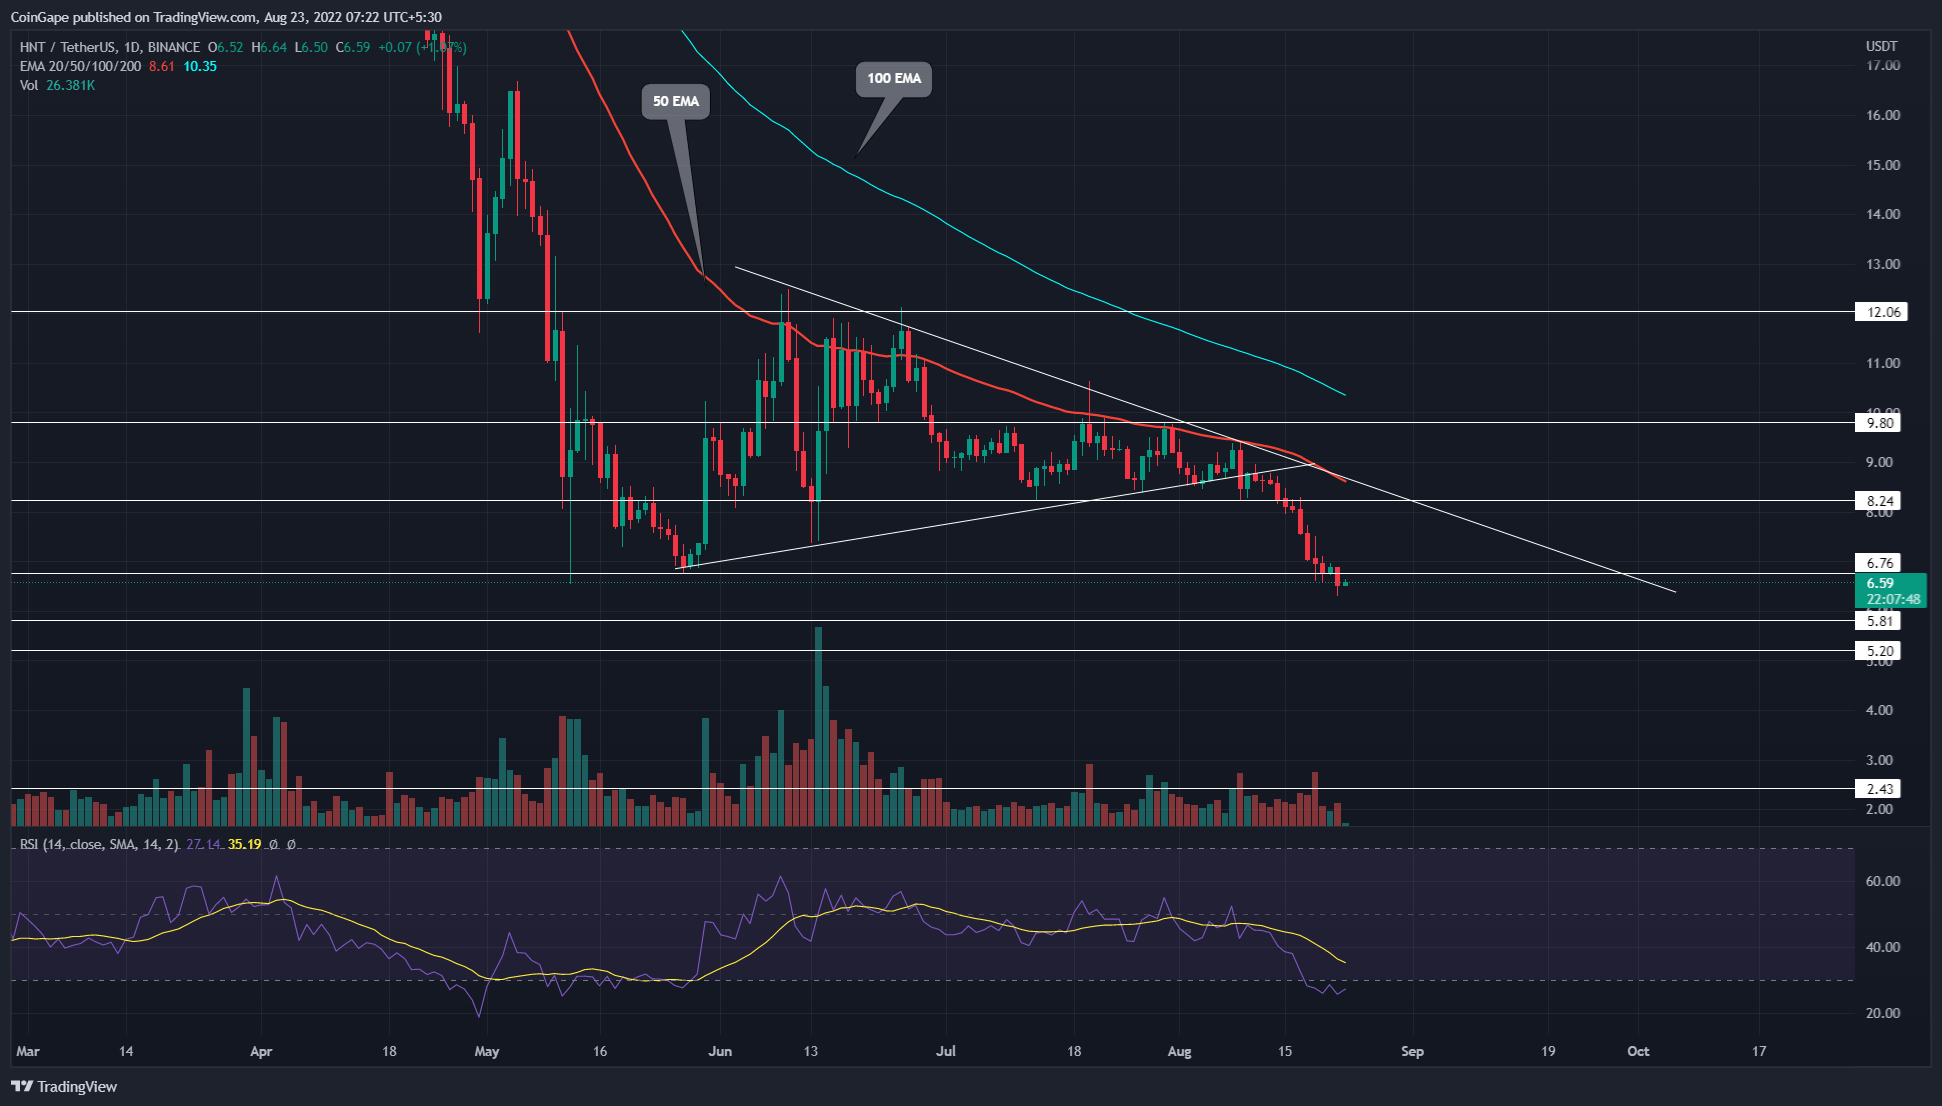
The symmetrical triangle pattern breakout triggered a drastic fall, plummeting the HNT price May low of $6.76. In addition, as the Crypto markets continue to suffer under a bearish cloud the coin price bridged this bottom support indicating a new 2022 low will be formed for Helium
Key points from HNT analysis:
The HNT chart shows a high Momentum breakdown from the %6.7.
Low volume retest offers an entry opportunity for interested short-sellers
The intraday trading volume in the Helium coin is $7.2 Million, indicating a 40 gain.

While several cryptocurrencies showed phenomenal growth in June and July, the HNT price kept wavering in a sideways rally. Furthermore, this price consolidation displayed the formation of a symmetrical triangle pattern in the daily time frame chart.
In theory, this continuation pattern triggers a direction rally when the price gives a suitable breakout from either trendline. Therefore, the recent upsurge in selling pressure triggered a bearish breakdown from this pattern.
The post-retest fall showcased ten consecutive red candles and plunged the HNT price by 24.7%. Thus, with sustained selling, altcoin slumped to the May low support of $6.75.
Starting the new week, the HNT price breached this bottom support indicating the continuation of the prevailing downtrend. Thus, the daily candlestick closing will allow sellers to test the $6.75 level as potential resistance.
If the coin price sustains below the $6.75 mark, the resulting downfall may plummet 22.5% lower to hit the next significant supply zone of $5.23.
Moreover, if the price shows some in-between bullish pullback, the trendline may assist sellers in maintaining this downward trend.
On a contrary note, closing above the resistance trendline will give an early sign of recovery.
Technical indicator
Relative Strength Index: The daily-RSI slope dived into the oversold region along with the support breakdown. The indicator value is so low, indicating a possibility of a bullish pullback.
EMAs: The downsloping 100-and-200-day EMA accentuates an overall bear trend. Moreover, the 50-day EMA acts as dynamic resistance for HNT price.
Resistance levels- $6.76 and $83.24
Support levels are $5.8 and $5.2
The post HNT Holders Loses May Low Support; What Next? appeared first on CoinGape.


