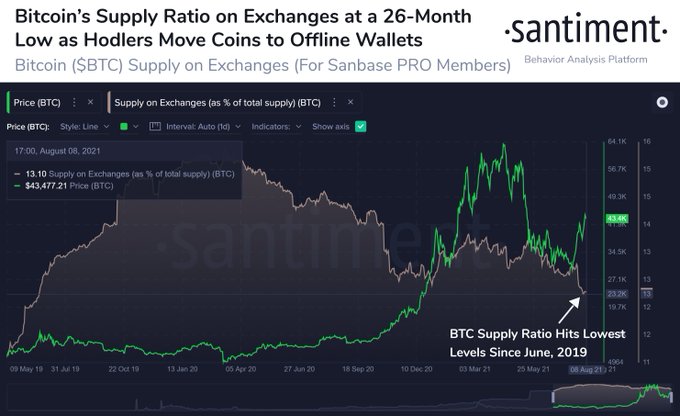
Bitcoin (BTC) holders continue to show their confidence in the leading cryptocurrency as the supply ratio on exchanges slumped to a 26-month low.

On-chain metrics provider Santiment explained:
“The ratio of BTC on exchanges has now fallen to its lowest point since June, 2019. This 26-month low should be viewed as a bode of confidence for holders of Bitcoin, as large exchange sell offs are less common when less supply is at risk on exchanges.”
Long-term holders have been leading the accumulation race, given that their BTC holdings recently surged to 66%. This holding uptrend was boosted by the recent dip, which saw lows of $29.5K hit.
Bitcoin miner reserves inch closer to a record-high
According to Jan Wuestenfeld, an analyst at CryptoQuant said:
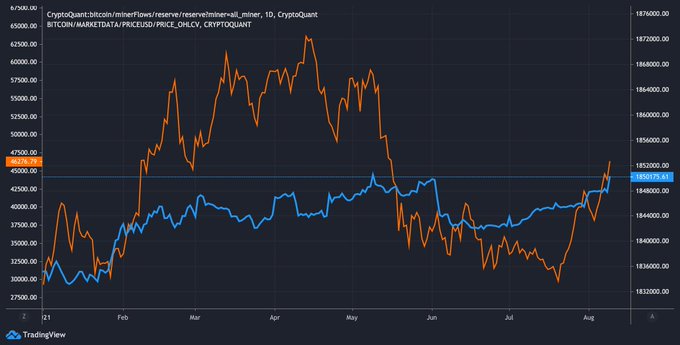
“Bitcoin miner reserves are back closer to this year’s ATH recorded on May 9. Miners have been adding BTC to their reserves in the last weeks.”
Dilution-proof echoed these sentiments. The crypto insights provider stated:
“Not just hash rate is recovering; Bitcoin miners are stacking sats again as well. Their balances are now above the levels of before the recent ban and hash rate drop again.”
Chinese authorities’ intensified crypto mining crackdown made Bitcoin miners experience diminishing returns as they were forced to shift base. As a result, at least 90% of China’s BTC mining capacity was hampered. Furthermore, BTC’s hashrate was nosedived by more than 50%.
Nevertheless, Bitcoin miners are recovering lost ground, as evidenced by an upward trajectory in their reserves.
Bitcoin reclaims the 200-Day Moving Average
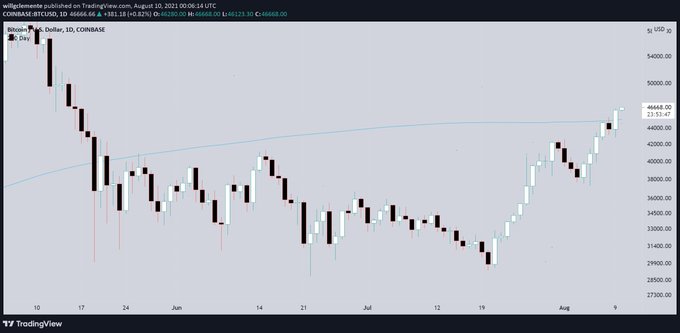
After nosediving to lows of $30K on May 20th, Bitcoin dropped below the 200-day moving average (MA) indicator for the first time since March last year.
Nevertheless, the leading cryptocurrency recorded its first daily close above this indicator since then on August 9, as acknowledged by on-chain analyst Will Clemente.
The 200 days MA is a key technical indicator used to determine the general market trend. It is a line that shows the average closing price for the last 200 days or roughly 40 weeks of trading.
Image source: Shutterstock


