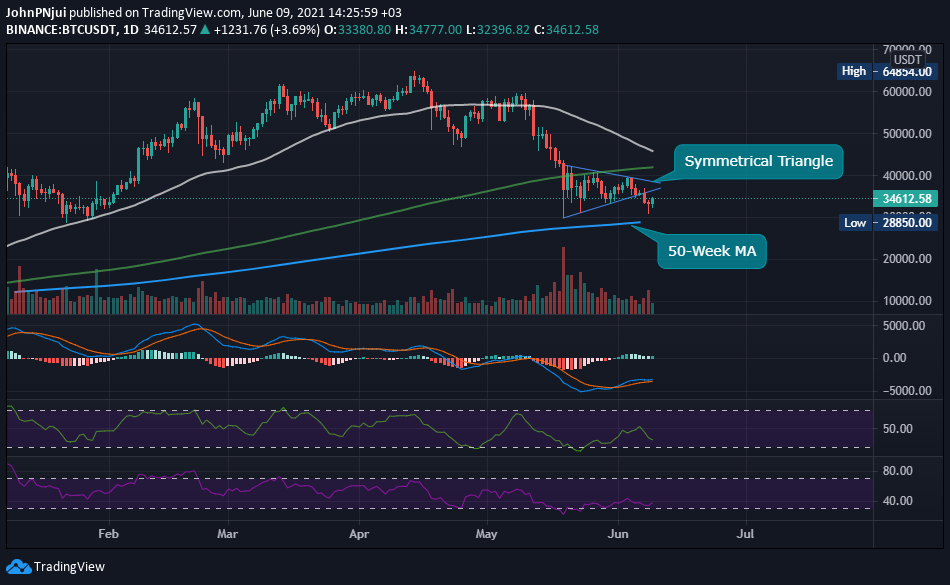
Bitcoin (BTC) could be gearing up for a relief rally at the 50-week moving average. This is according to analysis shared by popular BTC analyst, MagicPoopCannon, who also pointed out that Bitcoin’s symmetrical triangle that had formed since mid-May, has finally broken to the downside. Furthermore, the 50-week MA could provide an area for a nice bounce at the $28k to $29k price area.
Magic’s analysis of Bitcoin’s ongoing price action can be found below accompanied by the daily BTC/USDT chart highlighting the symmetrical triangle and the 50-week MA.
The symmetrical triangle in #BTChas finally broken to the downside. Expect further downside continuation, with a potential for massive support around the 28,0000-29,000 level. A hold of the 50 week MA could produce a nice relief rally. A failure there could cause panic selling.
Bitcoin’s Death Cross Seems Inevitable
Also from the chart, it can be observed that Bitcoin continues to trade below the 200-day moving average (green) with the earlier mentioned death cross, destined to occur in the next few days. Therefore, the relief rally mentioned by Magic might be short-lived given the fact that Bitcoin is very much in bear territory.
Bitcoin Trading Below the 200-day MA Signals the End of a Bull Market
In addition, and regarding Bitcoin trading below the crucial 200-day moving average, BTC and crypto analyst, Timothy Peterson, had earlier this week warned that BTC trading below this crucial metric had always marked the end of a bull run. His analysis of Bitcoin can be found below alongside a chart he shared demonstrating the historical significance of the 200-day moving average.
Bitcoin price has dropped below 200-SMA for 17 consecutive days and counting. This metic has *always* marked the end of a bull run and the start of a bear market.


