


In August, 61% of whale clusters changed positions during the pullback. This was unexpected during a period that seemed quiet. These shifts clarify why focusing on the btc support and resistance levels is crucial right now.
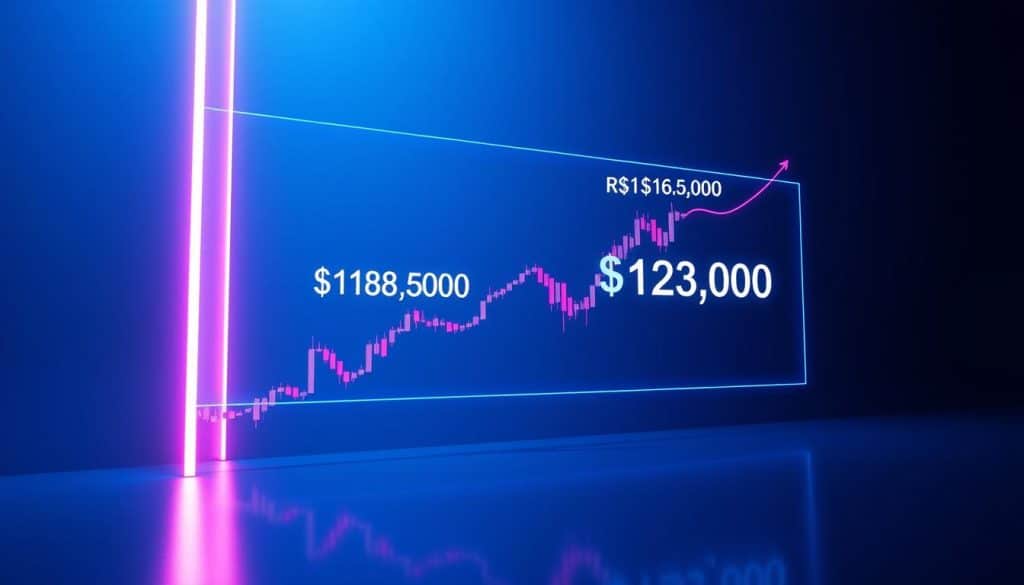
Today, I see 118,600 as the key support level and 123,000 as the top limit. Sources like CryptosignalApp and commentators noted Bitcoin’s fall from mid-August highs close to $124,000 to the mid-$115k range. Also, CryptoRobotics observed frequent tests of around 115,000, where the bids were not strong.
Some charts show a clear break above approximately 120,140, then a climb, while others indicate a rejection around the 120k to 123k zone. This includes tests of the 0.618 Fibonacci level near 113,626. Besides, there’s movement in EMA clusters and a hint of Bollinger squeezes. Moreover, CME futures are bringing extra support from big institutions.
For traders and those analyzing on their own, this summary highlights the key areas to watch today. Look at these btc levels as references for how big your trades should be. Also, use this analysis to set your risk levels before exploring deeper into the indicators and charts following this.

Key Takeaways
- 118,600 functions as the current short‑term support to watch; a break below could open deeper correction risks.
- 123,000 is the immediate resistance that, if cleared decisively, may renew bullish momentum intraday.
- Mixed 1H structure and EMA/Fib clusters mean traders should prefer scaled entries and clear stop levels.
- CME futures activity and on‑chain flows suggest institutional interest is shaping intraday moves.
- Use the identified btc intraday levels in conjunction with volume and volatility signals for better trade fidelity.
Overview of BTC Price Levels
I explain the way I look at Bitcoin during the day. Price moves around set points, so I stick to the 118,600 bottom and the 123,000 top. I use them as key guides for how much to trade and where to stop losses.
Understanding Support and Resistance
Price drops often happen near 116,000–118,000 because of past selling trends. If the price goes over the EMA50 with a lot of trading, the trend can change. This is why I view the 118,600 level as crucial for short-term buys.
A fair value gap is seen between 115,000–115,800 as a key supply zone. Between 111,000–110,500, demand blocks pull in trades on big price drops. Fibonacci levels, like the 0.618 at 113,626 and the 0.786 at 117,820, help in predicting price movements too.
EMA clusters—EMA34, EMA89, EMA200—help traders find dynamic support and resistance lines. A supply area between 120,000 and 123,000 meets these averages. This is why the 123,000 level often acts as a strong resistance in recent times.
Importance of Intraday Levels
For quick trades, I use intraday anchors. I look at 1H EMAs and decision points between 117,000–120,000 for planning entry points.
For day traders, short-term liquidity spots like the 115k FVG and 112k demand provide targets. Tools indicate that spots within intraday FVGs and character change zones are good for shorting.
Trading between the 118,600 support and 123,000 resistance requires careful risk management. I either go for fade or breakout tactics based on trading volume and candle patterns. These levels are crucial for both short and longer trades.
Current Market Sentiment
The market’s feeling is uncertain. On one side, big investors and dropping exchange reserves hint at a positive outlook. However, short-term patterns of declining peaks and troughs show unless the EMA50 is crossed again. This situation is like a battle of forces.
Some reports indicate buying interest near 120k, while others note rejections within the 120k–123k range. The market atmosphere is split and reacts to events, making it vital for traders to keep up with Bitcoin analysis constantly.
My advice: see the 118,600 mark as a short-term base and honor the 123,000 limit. Watching exchange reserves, open positions, and CME flows can give clues on trend changes.
Key Technical Indicators for BTC
I rely on specific tools to analyze price movement. These tools offer a clear view for daily trading. They help me know the difference between random movements and real trading opportunities. I get this insight from EMA clusters, momentum oscillators, and volatility bands on short-term charts.
Moving Averages
I keep an eye on EMA9 and EMA21 for spotting immediate trading chances and momentum shifts. If the price is under EMA50, it usually means the market might go down. But, if EMA50 isn’t changing much, it might mean the downward trend is slowing.
In daily trading, EMA50 often serves as a pivot point. The longer-term 200 EMA provides more solid proof of market direction. Certain EMA combinations can form strong support levels during market fluctuations.
When EMA34 is above EMA89 and EMA200, the trend appears upward. If EMA50 shows increasing volume, it suggests buyers might be getting the upper hand.
Relative Strength Index (RSI)
I find RSI indicators to give mixed signals. An RSI near 43 implies the market is steady, not crashing. Crossing back over 50 is a good sign the market might start climbing.
On smaller time frames, a low stochastic alongside an RSI near 50 suggests a potential rise. If there’s a bullish pattern on the 4-hour chart and prices are above key EMAs, it could mean a strong move. I check both 1-hour and 4-hour charts before deciding on a direction.
It’s important to watch RSI when prices aim high. If the 1-hour RSI goes toward overbought as trading volume increases, the price might surge. A balanced RSI view is key to avoiding rushed decisions.
Bollinger Bands
I pay close attention when Bollinger Bands start to squeeze together. This indicates that a big price move might be coming. Prices in the lower band suggest a potential drop during this tight movement.
Significant price changes often happen near the band edges. When bands squeeze and trading interest is high, big shifts are likely. This makes me adjust my trading stops and watch specific price levels closely.
I view a band squeeze as a signal to get ready, not as a direct call to action. Once bands widen with solid volume and matching moving averages, my trading decisions become easier.
| Indicator | Key Settings | What I Look For | Intraday Zones |
|---|---|---|---|
| Moving Averages | EMA9/21/34/50/200 | EMA9/21 for entries; EMA50/200 for bias; EMA clusters = support | 114.5K (200 EMA), 114,938 (50 EMA), 116K–118.5K (clusters) |
| RSI | RSI(21,9) with 1H & 4H cross-check | Above 50 = bullish edge; divergences for reversal clues | Watch behavior around 117.5K–117.8K for confirmation |
| Bollinger Bands | BB 21,2 | Squeeze = imminent breakout; expansion with volume confirms | Tight bands near 118,600; breakout targets toward 123,000 |
Current BTC Market Statistics
I keep a close eye on intraday activities. The market has been moving within a tight space, particularly focusing between 118,600 and 120,000. Using exchange charts, CME data, and on-chain flows, I get a clear short-term perspective along with a wider view.
Price Trends Over the Last 24 Hours
The price moved between $115,000 and around $120,000. Efforts to push it towards $124k to $128k faced immediate pushback. Some patterns on the hourly charts showed a decrease, testing $115k but didn’t attract many buyers.
There were times it went beyond $120,140, followed by a phase of little movement. A notable dip reached close to $113,600. My analysis suggests that prices are staying within a narrow band, often returning to the 118,600–120,000 range.
Trading Volume Analysis
CME futures trading went up as did the signs of higher leverage use. I observed notable increases in buying on futures platforms during positive moments. When the value dropped, the volume of trades diminished, indicating retreats were happening without a rush to sell. Rising volumes at peak resistance levels might mean some are offloading their holdings. Tools like CryptoQuant and Glassnode are great for keeping tabs on btc’s trading volume and exchange activity.
Market Capitalization Insights
More investment from big players and fewer coins on exchanges hint at a potential rise in market value. The bitcoin market is somewhat tied to the S&P 500 and DXY, making it reactive over brief periods.
Viewing btc’s market value is useful for overall direction but isn’t the best for making quick trades. I consider market cap against bigger financial news when looking at btc price movements.
| Metric | Observed Range / Value | Intraday Signal |
|---|---|---|
| Price (24h) | $113,600 – $128,000 | Choppy; key corridor 118,600–120,000 |
| btc trading volume (exchanges & CME) | Elevated on CME; mixed on spot | Rising at tops, declining on retraces |
| Open Interest | ~$40.8B (reported highs) | Higher leverage risk; monitor liquidations |
| btc market capitalization | Elevated; sensitive to macro | Useful for bias; less for intraday entries |
| Key decision points | 117k, 118,600, 120k, 123k | Watch volume and rejection patterns |
Graphical Representation
I make charts easy to understand at first glance. They use 1H for short-term decisions and 4H/1D for the overall look. I highlight the 118,600 support and 123,000 resistance on each timeframe. This helps to match quick moves with long-term trends.
On the btc price chart, I show an upward trend and a midpoint between 117k-119k. There’s also a note on failing to pass the 124k-128k range. The 1H chart points out gaps at 115k-115.8k, supply areas around 116.5k-117k, and demand near 110.5k-111k. It even includes short setup directions.
Fibonacci levels are marked on the chart, with specific points near 113,626 and 117,820. Around the 120k-123k area, you’ll see clusters of EMA and SMA, all underlined in red. I also use volume and open interest to show where most trades happen, backing up chart patterns and day-to-day choices.
The chart also shows Bollinger bands squeezing, indicating the market might make a big move. I draw arrows pointing to short-entry areas near 115k-115.8k. Plus, there’s mention of the recent ABC correction and potential turns in price between 122k-125k.
I clearly mark where the key support and resistance levels are. Support is at multiple points like 118,600 and down to 89k. Resistance levels go up to 136k. These marks help me decide where to stop losses or take profits based on current trading volumes.
To help with day-to-day trading, I suggest using EMA50/200 and FVG zones. This keeps the 1H chart in sync with the bigger picture provided by 4H/1D charts. It makes for better, more consistent trading decisions.
BTC’s Historical Performance
I often look back at BTC’s price history to understand current levels. We see patterns from past price changes. Highs and lows that once acted as barriers change roles once they are crossed. This shift is reflected in trading volumes, order flows, and how traders act.
When comparing recent and past price movements, the 116k–118k range stands out. It often attracts the price, like a magnet. Pulling away from this range has led to moves toward the 124k level. These past barriers later acted as temporary supports when regained, before flipping back under selling stress.
The 120k level is a significant barrier, both technically and psychologically. Repeated rejections near 121k–123k indicate heavy selling interest. This fits the pattern that round numbers create strong resistance, making the 123,000 level a tough ceiling to break.
The 118,600 level lies within a key support zone of 117k–119k, recognized by traders and analysts alike. They see this area as crucial for short-term price direction. For day-to-day trading, the 118,600 level helps decide where to set stops on long positions.
On the other hand, the 123,000 point is part of a major selling area between 120k–125k. Heavy selling often happens between 122k and 125k. If BTC breaks above the 123,000 resistance with strong volume, it might reach the 124k–128k range, indicating potential for further gains.
Past trends highlight key market influences. Lower amounts of BTC on exchanges suggest scarcity over time, despite short-term jumps in supply leading to price swings. Recent months showed important support levels forming, which are crucial for day trading.
Spikes in volume at peak prices, trades filling at fair value gaps, and reactions to Fibonacci levels have often directed the market. Retesting these areas before choosing a direction is common, resembling patterns seen in BTC’s past.
From experience, the range between the mid-$110k and low-$120k is critical for traders. Ignoring it could lead to sudden losses. In planning trades, I use the 118,600 support as a safeguard and aim for the 123,000 resistance, while also paying close attention to past price movements for extra guidance.
Factors Influencing BTC’s Price
I observe macro data and on-chain flow like I check my tools before trading. News items, even small ones, can slightly move prices within a day. Big news like the U.S. CPI reports often cause big, fast price changes that affect my bitcoin price analysis and how big I trade.
I keep an eye out for important economic reports and comments from the Fed. For instance, an unexpected CPI report once helped push bitcoin towards $120,000. But a falling S&P500 or a stronger dollar can make investors cautious. I use these trends to make smarter trades during bitcoin economic events and unstable times.
Regulatory news can quickly change how easy it is to trade. Announcements from the SEC, especially about ETFs or custody rules, have made a big impact before. When U.S. regulatory news is anticipated, I trade smaller and with more caution.
Big players like CME and major custodians affect how deep the market is. Talk about ETFs and clear custody rules can get more people to join, change price differences, and have an impact on bitcoin regulatory news related to trading and borrowing.
On-chain metrics give mixed messages. Exchange reserves going down is generally a good sign. But high inflows to exchanges and uneven funding rates suggest there might be a lot of selling pressure. I consider both in my analysis of market mood.
How prices move shows us where they might go next and where there are gaps in fair value. Changes in how much people are trading adjust the importance I place on mood indicators. Big news affects prices more when trading levels match what’s reported.
| Factor | Typical Impact | What I watch |
|---|---|---|
| Macro prints (CPI, jobs) | Sharp intraday swings; possible break of support/resistance | Economic calendar, Fed remarks, S&P correlation |
| Regulatory news (SEC, ETFs) | Changes in liquidity and institutional flows | ETF filings, custody rulings, CME open interest |
| On-chain flows | Exchange inflows signal selling; reserve drops support price | Exchange reserves, inflows/outflows, funding rates |
| Market structure | Limit absorption, fair value gaps guide retracements | Volume profile, orderbook, OI levels |
Predictions for BTC Movement
I always keep my view short and clear before looking at the charts. The market is tense right now. Traders are closely watching Bitcoin’s day-to-day price changes. At the same time, they’re considering larger trends. Here, I’ll share what I think might happen and what factors are important to me.
Short-term Price Forecast
I’m leaning towards a bearish view for Bitcoin in the short term. This is unless its price goes back up to between 116,000 and 117,000 with strong trading volume. I think it’s most likely that the price will drop to fill the 115,000 value gap. After that, it might go down further to test the interest around 112,000. If sellers keep up their pressure, the price could even drop to between 110,500 and 111,000.
However, there’s always a chance for prices to rally again. These rallies could push prices back up to between 115,000 and 118,000. If the price firmly goes above 117,000 to 120,000, I’d have to rethink my bearish views. Because the market can become very volatile very quickly, it’s wise to set tight stop losses.
Long-term Outlook
The long-term outlook for Bitcoin looks positive, as long as it keeps its key support levels. With exchange reserves going down and steady interest from big investors, we might see the price rise above current levels. If everything goes well with the overall economy, prices could reach between 122,000 and 132,000.
Still, if there are big economic shocks or a lot of selling all at once, the price could fall to 100,000 or even 88,000. When making long-term predictions, I see them as possible outcomes. I plan my trades so I can handle big price changes without too much loss.
Factors That Could Affect Predictions
- Unexpected big news about inflation, Federal Reserve decisions, or interest rates.
- Changes in rules or legal decisions that affect how people can trade.
- Big trades outside of public exchanges, major shifts by investors, or sudden moves of money into or out of exchanges.
- Important technical levels being reached with a lot of trading volume or significant price moves confirmed by interest in trading.
- Sudden big sales on futures markets or by traders using derivatives.
I see each Bitcoin price forecast as a range of possibilities. I get ready for price moves in either direction. I also plan my trades to weather sudden market changes. My strategy uses day-to-day Bitcoin price levels for deciding when to trade.
Tools for Monitoring BTC Levels
I keep my toolkit simple for monitoring btc intraday levels. My main tools include Binance for quick checks and trades. I also look at CME reports to understand what big investors are doing. For clear charts and sharing ideas, TradingView is my go-to. By combining these with order book depth and on-chain data, I get a complete view.
Trading Platforms and Software
I choose Binance and CME for their different strengths. Binance is great for swift trades. CME is my choice for big future market moves. TradingView offers a space where I can visualize trends and share insights with others. I compare different sources to confirm support and resistance levels.
I look at TradingView’s public ideas to feel the market pulse. It helps me find important price levels to watch. You can see what others are thinking on TradingView BTC ideas.
Technical Analysis Tools
My toolkit includes both classic and advanced tools. I use moving averages, RSI, MACD, and Bollinger Bands to gauge momentum. Fibonacci and Volume Profile help pinpoint key trading zones. I also track Fair Value Gaps and supply/demand blocks for better entry points.
For deeper insights, I turn to CryptoQuant and Glassnode. They show me how much btc is moving in and out of exchanges. This information often clarifies why certain price levels are significant. Combining traditional technical analysis with on-chain data makes my strategy more reliable.
Price Alert Systems
I set price alerts at major support and resistance levels. I also watch for changes in moving averages and volume spikes. These alerts help me act quickly on potential trades.
I use a variety of alert systems to keep informed. TradingView, exchange alerts, and mobile notifications from Crypto Pro or Blockfolio ensure I never miss out. For big movements, I pay attention to CME and Whale Alerts for insights into large investor actions.
Here’s a tip: Have trade templates ready and use different channels for alerts. This approach keeps you prepared. When a key price point is hit, you can act promptly and according to your trading plan.
FAQs about BTC Support and Resistance
I keep a short FAQ to answer common questions about trading intraday levels. This helps me determine where to enter trades and set stop losses. It can also help you make your trading plan clearer and simpler.
What is the significance of the support at 118600?
The 118,600 level is important because it’s where several key factors meet. These include moving averages, past points where the price was rejected, and areas with a lot of trading activity. Both big investors and regular folks often buy BTC at this level, showing it’s a strong support area.
Traders look at btc support 118600 to set smaller stop losses and to cautiously increase their investments. If the price falls below this point, watch for potential buyers around lower levels like 115k, 112k, and 110k. A close below this on a large timeframe indicates that bullish strategies might not work.
How is resistance at 123000 determined?
Resistance around 123,000 is identified by many times the price failed to break through within a 120k–125k zone. A combination of heavy sales orders and certain market analyses makes this a clear barrier. Many experts and data sources see this level as a good spot to take profits or start shorting.
If the resistance at btc 123000 breaks with a lot of trading, it could lead to rises toward 124k–128k. My strategy is to wait for a strong volume before increasing my investment. If there’s not much trading volume, I see it as a likely area where sellers are offloading.
How do intraday levels affect trading decisions?
Intraday levels like certain gaps, zones, and moving averages on shorter time periods help with deciding where to start and end trades. They point to where market interest and momentum might change. By observing the trading volume at these points, you can tell if a price move is significant or not.
My trading approach uses principles from btc price analysis faq. I go for smaller bets within the day, adjust my stop losses according to market swings shown by Bollinger Bands, and I keep an eye on trading volumes to steer clear of unexpected market shifts. This helps in reducing risks while still allowing for profitable quick trades.
- Entry tip: Wait for a retest of a level with supportive volume.
- Stop tip: Place stops beyond recent volatility extremes, not arbitrary round numbers.
- Risk tip: Scale in on confirmed breakouts and scale out near obvious supply zones.
Strategies for Trading BTC
I’m sharing my experience on trading BTC. It’s about quick thinking and having a plan. I’ll give you some ideas and rules I follow. These include keeping an eye on btc during the day, planning trading strategies, and how to decide on trading sizes for longer term trades. My aim is to have clear entry points, follow simple rules, and manage risks well.
Day Trading Techniques
When day trading BTC, I use 1-hour and 15-minute charts. I look for price gaps between 115000–115800, quick profits from bounces at 118600, and sell when I see rejection at 123000. For shorts, I place stops above the 117000–118000 range.
Order book depth and limit orders help me decide when to enter trades. CryptoRobotics suggests shorting between 115k–115.8k with first targets near 113k and stops above 117k. I keep my trades small and use volatility for stop adjustments. I avoid making trades during big news events.
Swing Trading Approaches
For longer trades, I use 4-hour and daily charts. Spotting a 4-hour bullish trend can change my strategy to long. I start buying between 110000–105000 and sell around 117400–120000.
A daily close over 115500 with more trading volume can aim for higher targets. I adjust my trades based on weekly trends and exit slowly. This way, a loss won’t erase all my gains.
Risk Management Tips
Risk management is super important. I risk 1–2% of my capital per trade and set stops wisely to avoid small market moves kicking me out of trades.
Open interest and funding rates are key. High open interest and positive rates can lead to unexpected moves. I have a plan for sudden drops and don’t put all my money in when everyone else is.
I follow three rules: trade small, set clear stops, and have a target. For more tips, I look at BTC intraday ideas on TradingView for updates on market levels and structure.
Evidence Supporting Current Levels
I track on‑chain flows, exchange movements, and futures data every day. I use solid data instead of just guessing. This mix of data and direct observation sheds light on certain price trends.
I will now detail three kinds of evidence that support daily trading patterns. They include block trades, the marks of big players, and patterns in volume. These indicators help me figure out if a price change is temporary or a real shift.
Major on‑chain flows and whale behavior often show the fingerprints of large orders.
When CryptoQuant notes high exchange inflows, it usually means sell pressure. Large block trades and OTC deals lead to sudden volume increases and shifts in interest. These changes often happen in areas with lots of sell orders or near big selling points.
Institutional activity leaves a different trail, mostly in futures and custody flows.
More CME futures and buy-side demand suggest stockpiling. Drops in on‑chain reserves at major custodians align with professional buying reports. Yet, high open interest can amplify price moves when leverage is adjusted, highlighting the role of institutional investors in market movements.
Volume structure ties the story together and helps validate breakouts.
Volume typically drops during retracements but spikes at market peaks. I link btc volume with price to identify true breakouts. A big move in trading often follows when Bollinger Bands stay narrow without expanding until a key event happens.
Combining exchange inflows, CME interest, and volume pockets makes patterns clearer. A volume-and-futures-supported break is more trustworthy. This cross‑check is key for understanding btc price levels.
Here’s a brief overview of the signals I watch and their effects:
| Signal | Typical Observation | Implication for Levels |
|---|---|---|
| Exchange inflows/outflows | Sharp inflows ahead of selloffs; steady outflows during accumulation | High inflows reinforce resistance around clustered orders; sustained outflows support level flips |
| Large block trades / OTC | Volume spikes and rapid OI shifts on trade days | Creates or defends support and resistance through liquidity sweeps |
| CME futures & open interest | Rising OI during rallies; heavy positioning at key zones | Amplifies moves and explains why btc institutional investors can turn intraday levels into wider swings |
| Spot trading volume | Volume compression in range; bursts at breakouts or distribution | Volume confirmation validates breaks; shows btc trading volume correlation with sustained moves |
| Orderbook clusters | Large sell walls near 125k; bids concentrated near 118.6k | Clusters act as magnets for price and explain btc major transactions impact on intraday action |
Conclusion and Future Outlook
I synthesized price movements, trading volumes, and blockchain data for a succinct btc analysis. This shows important support at 118,600 and resistance at 123,000. The current outlook is somewhat negative, but could improve if certain trading bands are surpassed with notable trading volume. Pay attention to the highlighted zones like 115k–115.8k for buying and 120k–123k for selling, confirmed by trading interest and market flows.
Trading btc daily involves expecting fluctuations between 118,600 and 123,000. There’s a chance for declines to 112k if selling increases. Watch how trading volumes change — less volume when prices drop and spikes when prices fail to break through suggests sellers are in power. However, surpassing the EMA50 and breaking 123k with lots of trading could signal moves up to 124k–128k.
For trading btc, I suggest using definite rules for entering trades. Make sure trading volumes and trends across different time frames agree before risking money. Always set stop losses, be smart about how much you trade, and spread your investments. Keep an eye on the broader economy and use resources like TradingView and CryptoQuant, along with futures data, to make informed decisions instead of just following news.
I approach trading with caution and record my trades. The market can always surprise us, so it’s wise to be ready for anything. Consider 118,600 and 123,000 as benchmarks but be flexible, adjusting to new trading data and market trends. Keeping risks in check and making decisions consistently is key. Following these disciplined strategies, paying attention to volumes, and respecting key price levels should guide you well.